|
Technical Issues - FilmStar News 2015 Other editions:
2006, 2007, 2008,
2009, 2010,
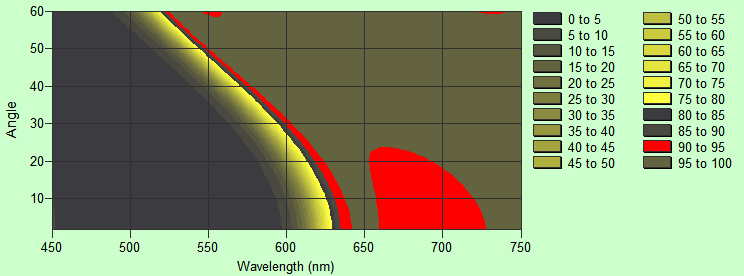
2011, 2012 January 5 Contour Data Import/Export DDE (dynamic data exchange) is a protocol for transferring data and commands. As previously discussed, it's an easy way to export FilmStar data to Excel. Users who need to compute properties (min, max, average, etc.) over an angle range can utilize DDE export in contour mode (DESIGN 2.61.3362), as in the highpass example shown below. Note the ability to highlight a region by clicking on the legend. While copy and paste requires several steps, DDE requires one step or no step if Auto Export is enabled. BASIC is not required but can be used to automate operations.
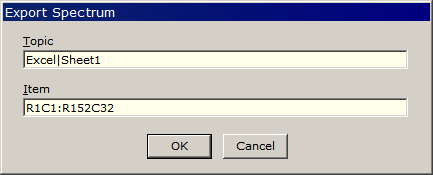
Where to put the data? Specify export region with Spectra.. DDE.. Options.. Export. Topic defines the Excel target worksheet. Equivalent: Excel|Sheet1, Excel|DDETest.xls, Excel|[DDETest.xls]Sheet1. If the workbook has not been saved, you could use Excel|Book1, etc.
Item specifies cell range (RC format) or defined name. Click Spectra.. DDE.. Export <Shift+Ctrl+F7> or check Spectra.. DDE.. Auto Export to automatically export calculated data. Import and export formats are identical. Be sure to set Contour Data = Matrix in Spectra.. Format Options.
DDE data transfer can be automated with BASIC DataExport and DataImport.
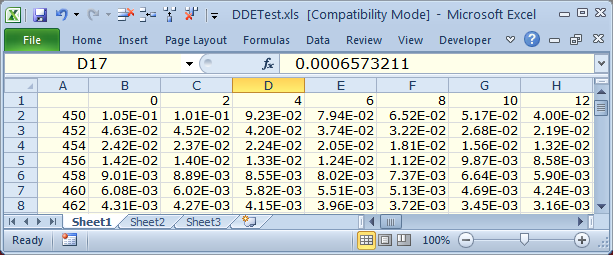
Example (S-P difference): set Sheet3 = Sheet2-Sheet1 (Sheet3!B2 = Sheet2!B2-Sheet1!B2,
etc.). Download
DDETest.xls
and run the FilmStar BASIC code listed below. The same method applies to calculated
and measured spectra; this should be very useful for users with
multiple-angle accessories (ARTA,
URA). Sub Main ' DDE example FilmStar DESIGN <-> MS Excel ' Range: 450-750 x 2 nm (151 points), 0-60 x 2° (31 points) Pol = "P": Calculate DataExport "Excel|Sheet1", "R1C1:R152C32" Pol = "S": Calculate DataExport "Excel|Sheet2", "R1C1:R152C32" DataImport "Excel|Sheet3", "R1C1:R152C32" ' Run Excel VBA Sub ClearCells via DDE k& = DDEInitiate("Excel", "DDETest.xls") DDEExecute k&, "[RUN(""ClearCells"")]" DDETerminate k& End Sub
If more than one Excel workbook is
open, add its name in brackets, e.g.
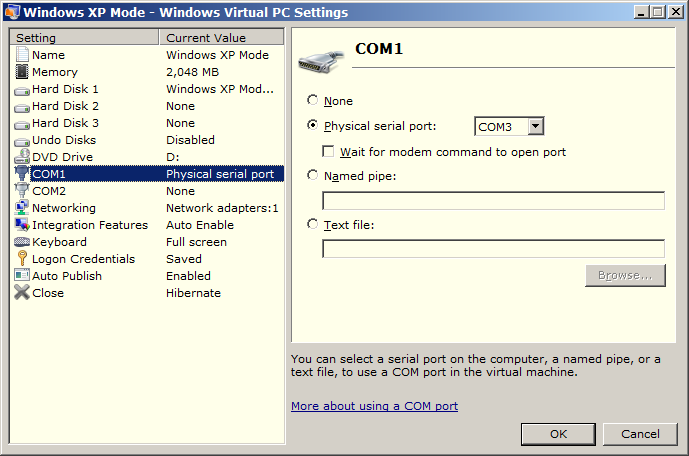
Excel|[DDEtest.xls]Sheet1. February 5 COM Port in Windows 7 XP Mode You have Windows 7
64-bit but need to run legacy 16-bit software in conjunction with
MEASURE (Scantraq). You've installed
Windows XP Mode but can't get your Lambda 9 or 983 to work via
serial interface. Windows 7 has assigned COM3 to your USB serial
adaptor, but the setting doesn't work in XP Mode. What to do?
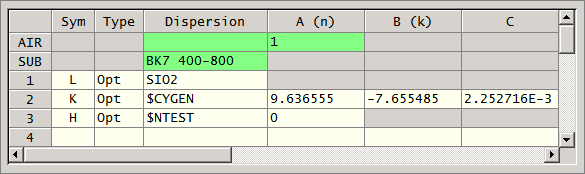
March 5 Solving for k with Known n (Updated March 17) Note: This topic assumes familiarity with User Index Functions and FilmStar BASIC. Consider dielectrics
(k<<n) where n is known and k is to be determined by transmittance
measurements. In the case of an uncoated substrate we can simply utilize FilmStar INDEX. In determining k values for films there are two
options for n: 1. function, 2. dispersion table.
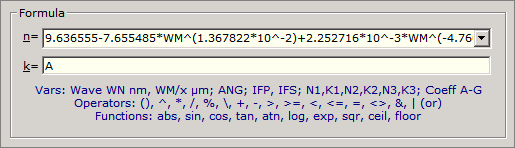
Generalized Cauchy ($CYGEN)
equation n=A+B*w^D+C*w^E (w in µm), k=0
2. Dispersion table
(n vs. wavelength): In this case, which users might find
simpler, we define a User Index
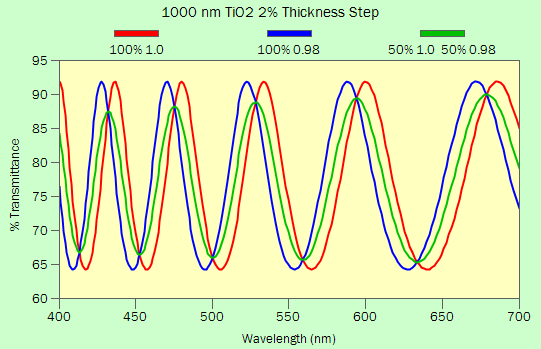
Function with n=N1, k=A where N1 refers to the Table 1 file. Note: This example sets UserIndex values in c:\Winfilm\Config\Design1.ini. We suggest that you rename section UserIndex to UserIndexBak in case you need to recover previous User Functions. April 14 Non-uniform Coatings What happens when a coating is non-uniform? To get a quick idea, consider a 2% step: half the coating at 100% design thickness and half at 98% thickness. The calculation is performed by the easily modified BASIC code below. Property Tooling simplifies matters by multiplying all layers by the same factor.
A BBAR coating is hardly affected. In the case of a highpass, the cut-on slope is degraded, but the filter might still meet specifications. Now consider the spectrum of a thick single layer (n=2.4) utilized in refractive index determination. Fitting the green spectrum obviously leads to severely incorrect n and k values. The thicker the film the stronger the effect, as can easily be determined by any FilmStar user.
This unusual situation was reported by
a prospective user. One would expect that 2% variation is more
typical of an entire coating run than a single optic. Possibly the
test part is mounted in the chamber in such a way as to create
thickness fall-off at the edges? In that case the test optic should be
masked when measured so that only the uniform center is utilized. May 21 Circle Diagrams
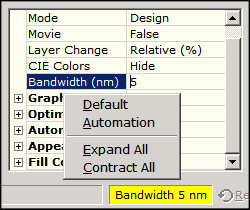
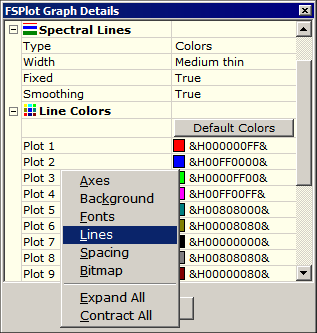
November 2 Interactor and FSPlot Popup Menus
December 10 Ambiguity in n,k for Single Films The determination of
dispersion in oxides depends on
the material following known functions such as Cauchy. But when no
such functions apply, we are forced to determine n,k point-by-point,
a more challenging task. There are two FilmStar possibilities:
DESIGN with Sub IndexSolve or program INDEX.
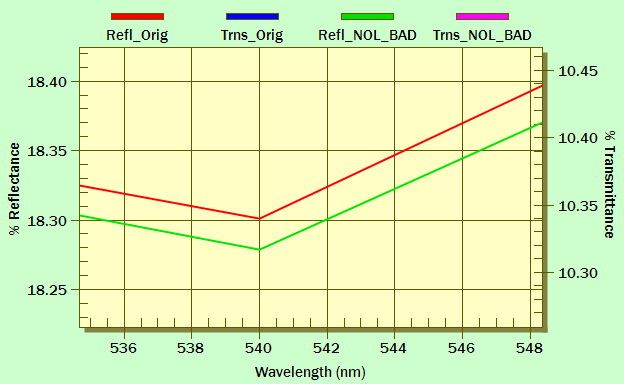
TIP: A1_Gedanken.faw utilizes Archive n,k Data mode where n,k data is buried in the design. To plot n,k vs. wavelength in INDEX, click <View n,k Table> in DESIGN Film Indices followed by File.. Plot Table <F4>. For DESIGN < 2.61.3850 copy the table with <Ctrl+C>, activate INDEX (click or <Alt+TAB>), click File.. Paste Table <Ctrl+V>, and Graph.. Auto Scale <Ctrl+A>. By looking harder with FSPlot's zoom function we finally discover the minor differences shown below. But realistically a 0.02% difference is well within measurement uncertainty.
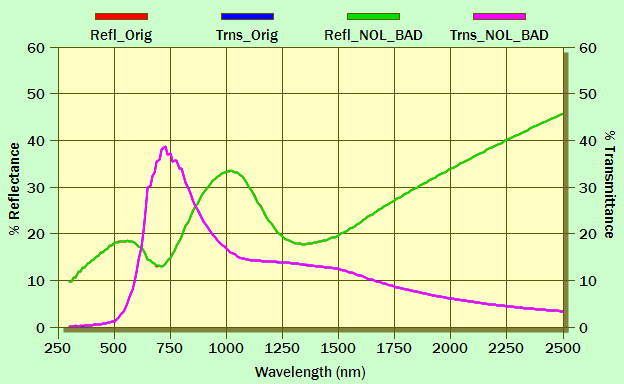
INDEX includes two algorithms: DLS and
NOL. In the above case DLS fails for 258A but works for 73A. NOL
works when correct limits are set for n and k variation. In NOL_BAD, n was allowed to vary from 0 to 6 instead of 1 to 6. INDEX DLS results were similar to using Sub IndexSolve.bas in DESIGN at
one angle. What works best? In our opinion, IndexSolve.bas
with multiple angle & polarization measurements. How to be sure that
n,k applies in general and not just to one thickness? Verify with
films of half and twice the thickness. Option Explicit DefInt I-N DefSng A-H, O-Z ' Adjust standard deviation in next line Const StdDev = .002 Sub Main Dim j, k, nData, ydata(), yd() On Error Resume Next CalcPlot ' Calculate and show plot ydata = Spectrum_Y ' Get spectrum nData = UBound(ydata, 1) CalcRandSeed 1 ' Same random numbers For j = 1 To nData ydata(j, 1) = ydata(j, 1) + StdDev * RndNorm ' Refl ydata(j, 2) = ydata(j, 2) + StdDev * RndNorm ' Trns If ydata(j, 1) < 0 Then ydata(j, 1) = 0 If ydata(j, 2) < 0 Then ydata(j, 2) = 0 If ydata(j, 1) > 1 Then ydata(j, 1) = 1 If ydata(j, 2) > 1 Then ydata(j, 2) = 1 Next j Spectrum_Y = ydata AxesDraw: Replot: Busy False: DataCopy AppActivate "FilmStar INDEX" SendKeys "{F11}", True ' Paste spectrum in INDEX End Sub This topic requires further development, but it is apparent that n,k solutions require some thought. |
Copyright © 2023 FTG Software Associates
Last updated on
January 31, 2023